
Analysis
Facet
Count: # of Edges
Dimension: Communities
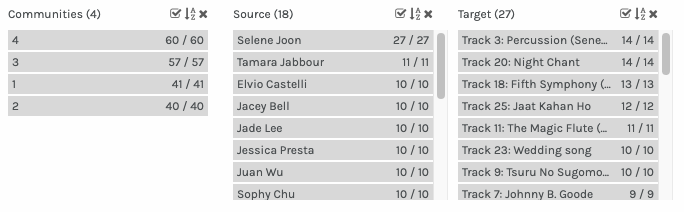
There are 4 members in the community (1) I’m in, they are Tamara Jabbour, Simin Rupa, Jade Lee and myself.
Later I went to read my community members’ posts and surprisingly found out that we almost all use the criteria to find “the best representation of the sounds from earth”, and a good combination of nature and man-made sound.
* Click the names to go to their post page. But I couldn’t access Tamara’s.
Facet
Count: # of Edges
Dimension: Target
Target here stands for the options we have to choose. The top 3 choices are:
– Track 3 : Percussion
– Track 20 : Night Chant
– Track 18 : Fifth Symphony
Facet
Count: # of Edges
Dimension: Source
Source here indicates the # of people in this file, and how many choices they made.
For some reasons, Selena seems to have selected all the options and Tamara picked 11 out of 27. Every one else all picked 10.
Reflection
Is the visualization able t o capture the reasons behind the choices? Can the reasons for these “null” choices ever be reflected/interpreted in the data?
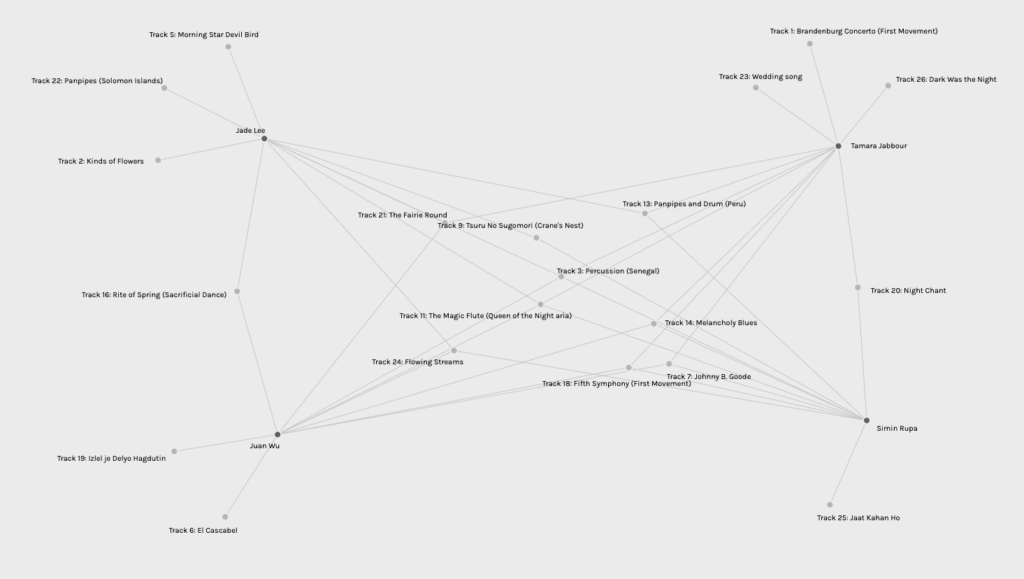
I think if people know the soundtracks well enough, the community dimension can somewhat reflect what kind of music/sounds people chose. However, these soundtracks are not strictly categorized. And we do not have equal number of the same type of soundtracks.
I think if we better categorize these options, we will be able to have a better idea of analyzing people’s preferences. However, this assignment is, after all, quite personal, it is hard to fully analyze the logic behind every choice. Just like my community, we said we want to find the ones we think best represent Earth, however, that criteria vary from person to person and heavily affected by their background, value and knowledge etc.
Reflect on the political implications of such groupings considering what data is missing, assumed, or misinterpreted?
The graph did not tell us anything about the people who made those choices. The demographic. Similarities are shown through the community dimension, however, without weights or direction for any of the nodes, there’s no way for us to know which soundtrack is the top 1 for each person or if there was a ranking of their selection.
The community dimension would easily lead people to a quick assumption that “these people must have chosen these tracks for the same reasons.” However, this is lacking any indication for the ones they didn’t choose. I don’t fully understand the setting of Palladio, I tried to upload different data files, but there are only 4 communities for every file. The number of communities always remains the same only the number of edges change for different communities.
In that case, some people would have been forced to fall into one of them and might cause misinterpretation.
References:
Innovation, S. (2015, April 18). Graph Theory Overview [Video]. YouTube. https://www.youtube.com/watch?v=82zlRaRUsaY&feature=youtu.be
Innovation, S. (2015b, April 19). Network Connections [Video]. YouTube. https://www.youtube.com/watch?v=2iViaEAytxw&feature=youtu.be
Hi Jane! Thanks for sharing your outcomes from the networking task. I like your proposals to capture specific metadata. Correct me if I am wrong but it seems you are proposing categorization tags to better identify unique traits in the songs and a systematized enumeration of choices to see what participants deemed to be most/least important. I completely agree with these suggestions: more robust data would create more robust results.